
Why GIS?
The communities your organization serves are shaped by geography. Where people live, what services are nearby, how systems overlap. These patterns are invisible in a spreadsheet and obvious on a map.
The foundation
What is GIS, and why does it matter for the social sector?
Geographic Information Systems (GIS) are tools for collecting, analysing, and visualising data tied to location. They let analysts ask not just what is happening, but where, and to find the patterns, gaps, and concentrations that drive better decisions.
In health, housing, and social services, place is rarely a neutral variable. Access to care, risk of homelessness, exposure to environmental hazards, proximity to employment. All of these are distributed unevenly across communities, and that unevenness matters for planning, funding, and policy.
Geo-Lens brings GIS analysis to research, evaluation, and strategy projects where location is part of the story. That means clearer evidence, stronger funding cases, and recommendations that reflect the real geography of need.
Service gap mapping
Identify where demand exists and where services don't reach.
Population analysis
Understand who lives where and how community composition affects need.
Outcome visualization
Connect program results to place for reporting and advocacy.
Systems overlap
See how housing, health, justice, and social systems intersect geographically.
In practice
How Geo-Lens applies GIS across our work
We use spatial analysis to map population need, service distribution, and outcome variation, producing evidence that funders, policymakers, and program designers can act on.
GIS gives strategic plans a geographic grounding. Whether scoping a catchment area, identifying underserved communities, or modelling future demand, location data strengthens the case for investment.
Place-based dashboards and visualisations turn program data into board-level intelligence, showing not just whether outcomes were achieved, but where, and for whom.
The Non-Profit Case
GIS strengthens non-profit programs, services, and community impact
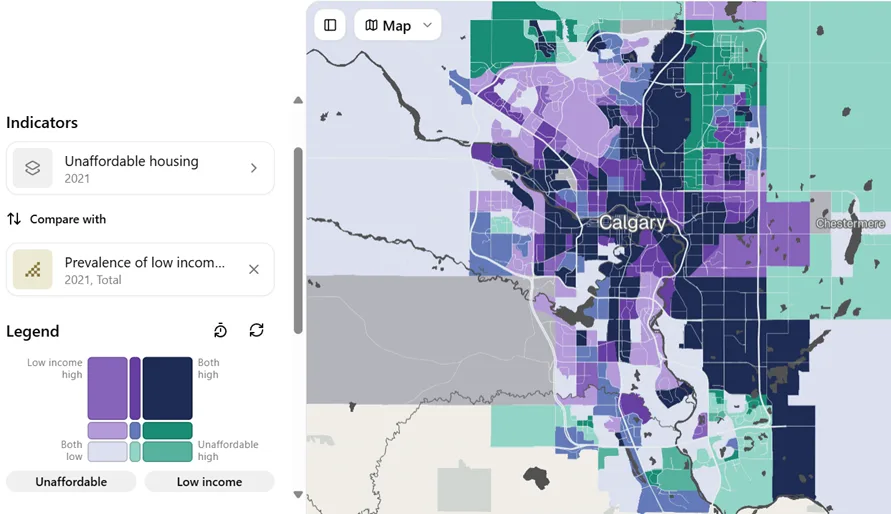 Housing Affordability · Calgary
GIS & Spatial Analysis
Internal Project · Calgary Housing Affordability Mapping
Mapping Housing Cost Burden and Low-Income Prevalence in Calgary
A census tract-level spatial analysis of housing unaffordability and low-income prevalence across the Calgary region, using comparative GIS mapping to identify neighbourhoods where financial strain and shelter-cost burden overlap.
23% of households facing unaffordable housing costs · 9% low-income prevalence · 0.70 tract-level correlation
Identifying community needs and assets
Non-profits already collect valuable data about the populations they serve. GIS turns this information into spatial insight, showing where needs are concentrated, where service gaps exist, and where community assets can be leveraged.
Improving service delivery and accessibility
GIS helps organizations determine where and how services should be delivered. It identifies geographic barriers, transportation challenges, and underserved areas, supporting more equitable, efficient, and client-centred program design.
Strengthening decision-making and resource allocation
GIS helps non-profits prioritize limited resources, assess program reach, and identify patterns that may not be visible in tables or spreadsheets.
Communicating complex issues clearly
Maps make social issues easier to understand. They support communication with communities, partners, funders, and policymakers while strengthening engagement and co-design.
Supporting research, evaluation, and impact reporting
GIS enhances research and evaluation by combining spatial and statistical analysis. It helps organizations demonstrate reach, outcomes, and impact for reporting, advocacy, and knowledge sharing.
Want to bring a geographic lens to your next project?
Whether you're building a funding proposal, designing a strategy, or evaluating a program, we can help you use location data to tell a clearer story.